
One short PDF every month. No spreadsheets.
Delivered by the 10th, covering the month before. It takes about five minutes to read and tells you what to do about what it finds.
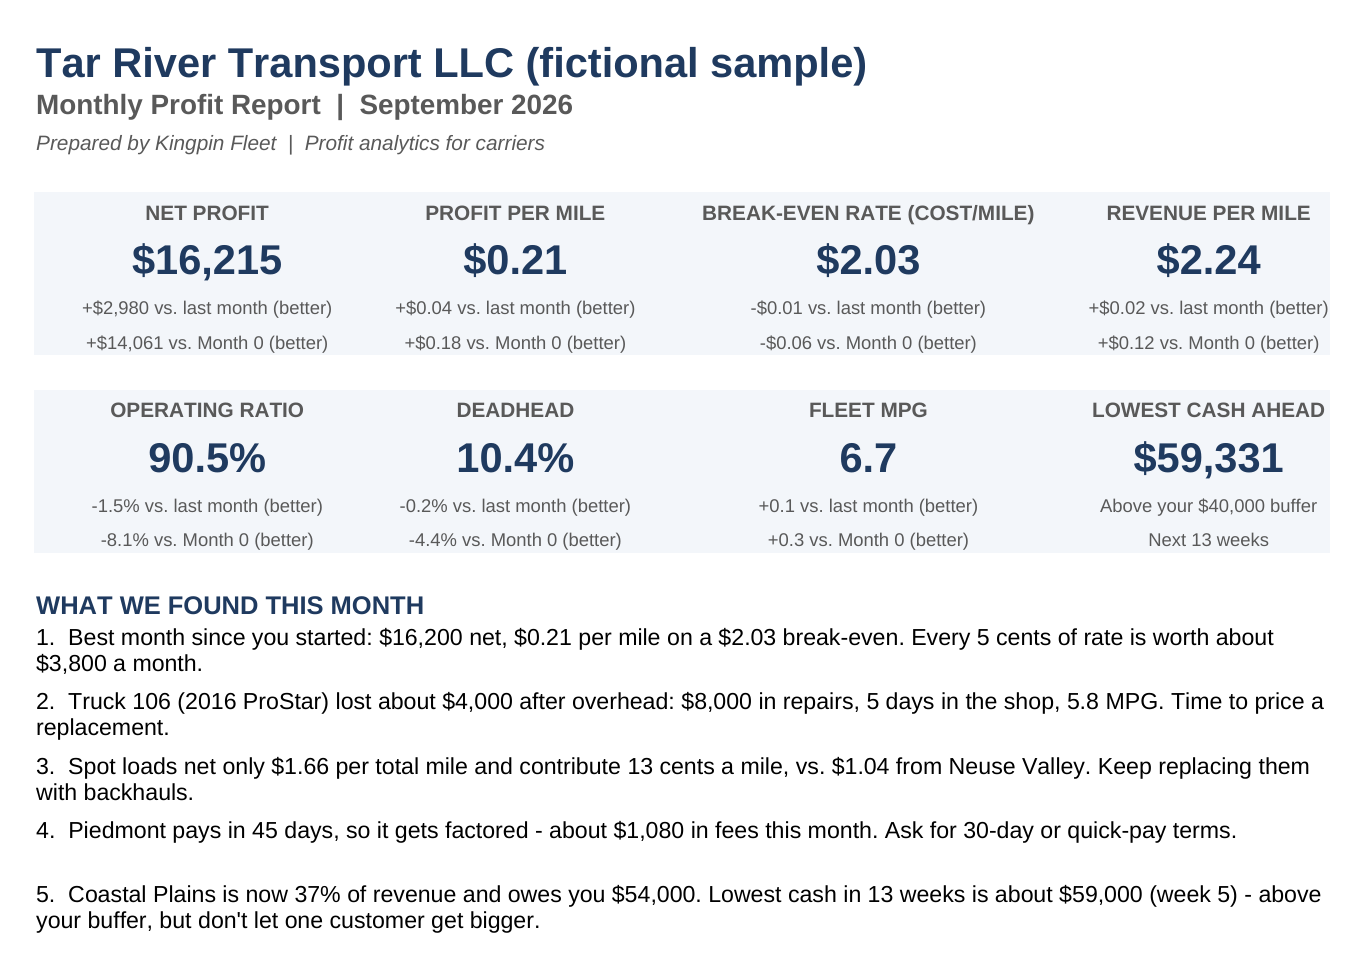
Profit scorecard
Net profit, profit per mile, break-even rate and operating ratio, compared with last month and with where you started.
Truck-by-truck results
Miles, profit per mile and a Strong / Caution / Weak rating for every truck, so you know which ones to fix, sell or replace.
Customer results
Revenue per mile, share of revenue and payment speed for each customer. It also shows when you rely too much on one customer.
13-week cash forecast
Your lowest cash point over the next quarter, compared with the cash buffer you set.
Efficiency trends
Deadhead percentage, fleet MPG and operating ratio, charted month over month.
Results tracking
Every change you make gets logged, so you can see what the report is worth to you in dollars.
 Open the full sample (PDF, 3 pages)
Fictional 8-truck NC carrier. Here's what that report caught:
One truck losing money after repairs and shop days, while the fleet looked fine overall.
A slow-paying customer driving about $1,080 a month in factoring fees.
Spot loads paying less per mile than the contract customers they were replacing.